> ## Documentation Index
> Fetch the complete documentation index at: https://docs.lumos.com/llms.txt
> Use this file to discover all available pages before exploring further.
# Get Started with Customizable Dashboards
Customizable Dashboards replace weekly CSV exports and spreadsheet reports with interactive dashboards about your identity and access environment that update automatically.
## Overview
With Customizable Dashboards, you can:
* **Discover insights** about shadow IT, security risks, and license optimization
* **Create custom visualizations** using the dashboard builder and AI assistant
* **Share live dashboards** with stakeholders instead of static spreadsheet reports
* **Export data to CSV** for external analysis and presentations
Replace the time-consuming cycle of exporting data → building Excel pivot tables → creating static reports with interactive dashboards that stakeholders can access directly and that update daily with fresh data.
## Step 1: Access Your Analytics Dashboard
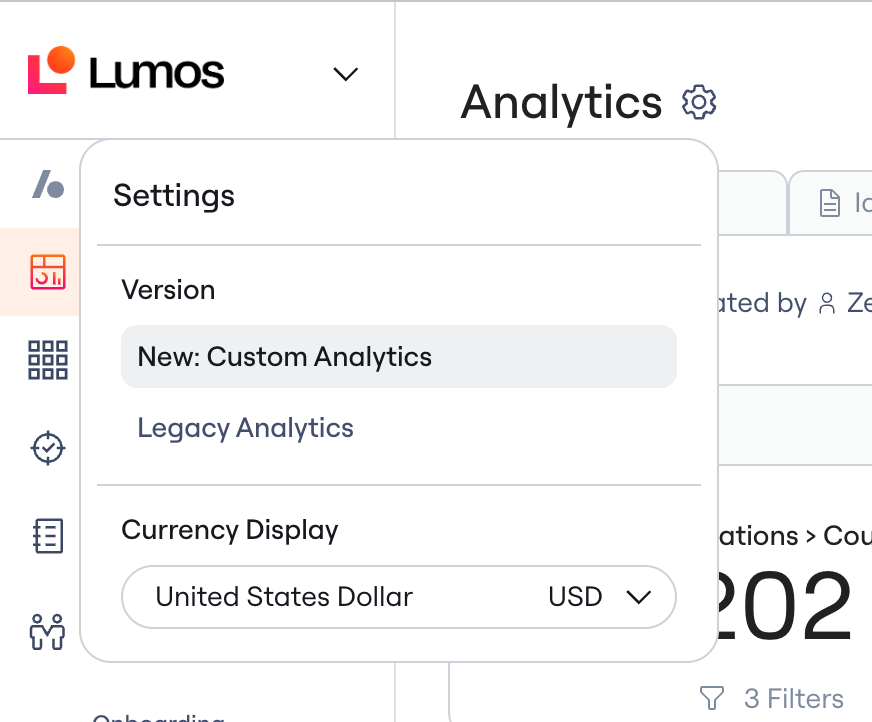
Navigate to **Analytics** in the top navigation bar. You should see the new customizable dashboards. To access the legacy dashboard, you can use the settings to toggle between "**Legacy Analytics**" and "**New: Custom Analytics**"
 **Note**: If you don't see the Analytics tab, verify your permissions with your Lumos administrator. By default, organization admins and readonly organization admins can access Analytics, but your admin can also share specific dashboards with you.
## Step 2: Start with Pre-Built Templates
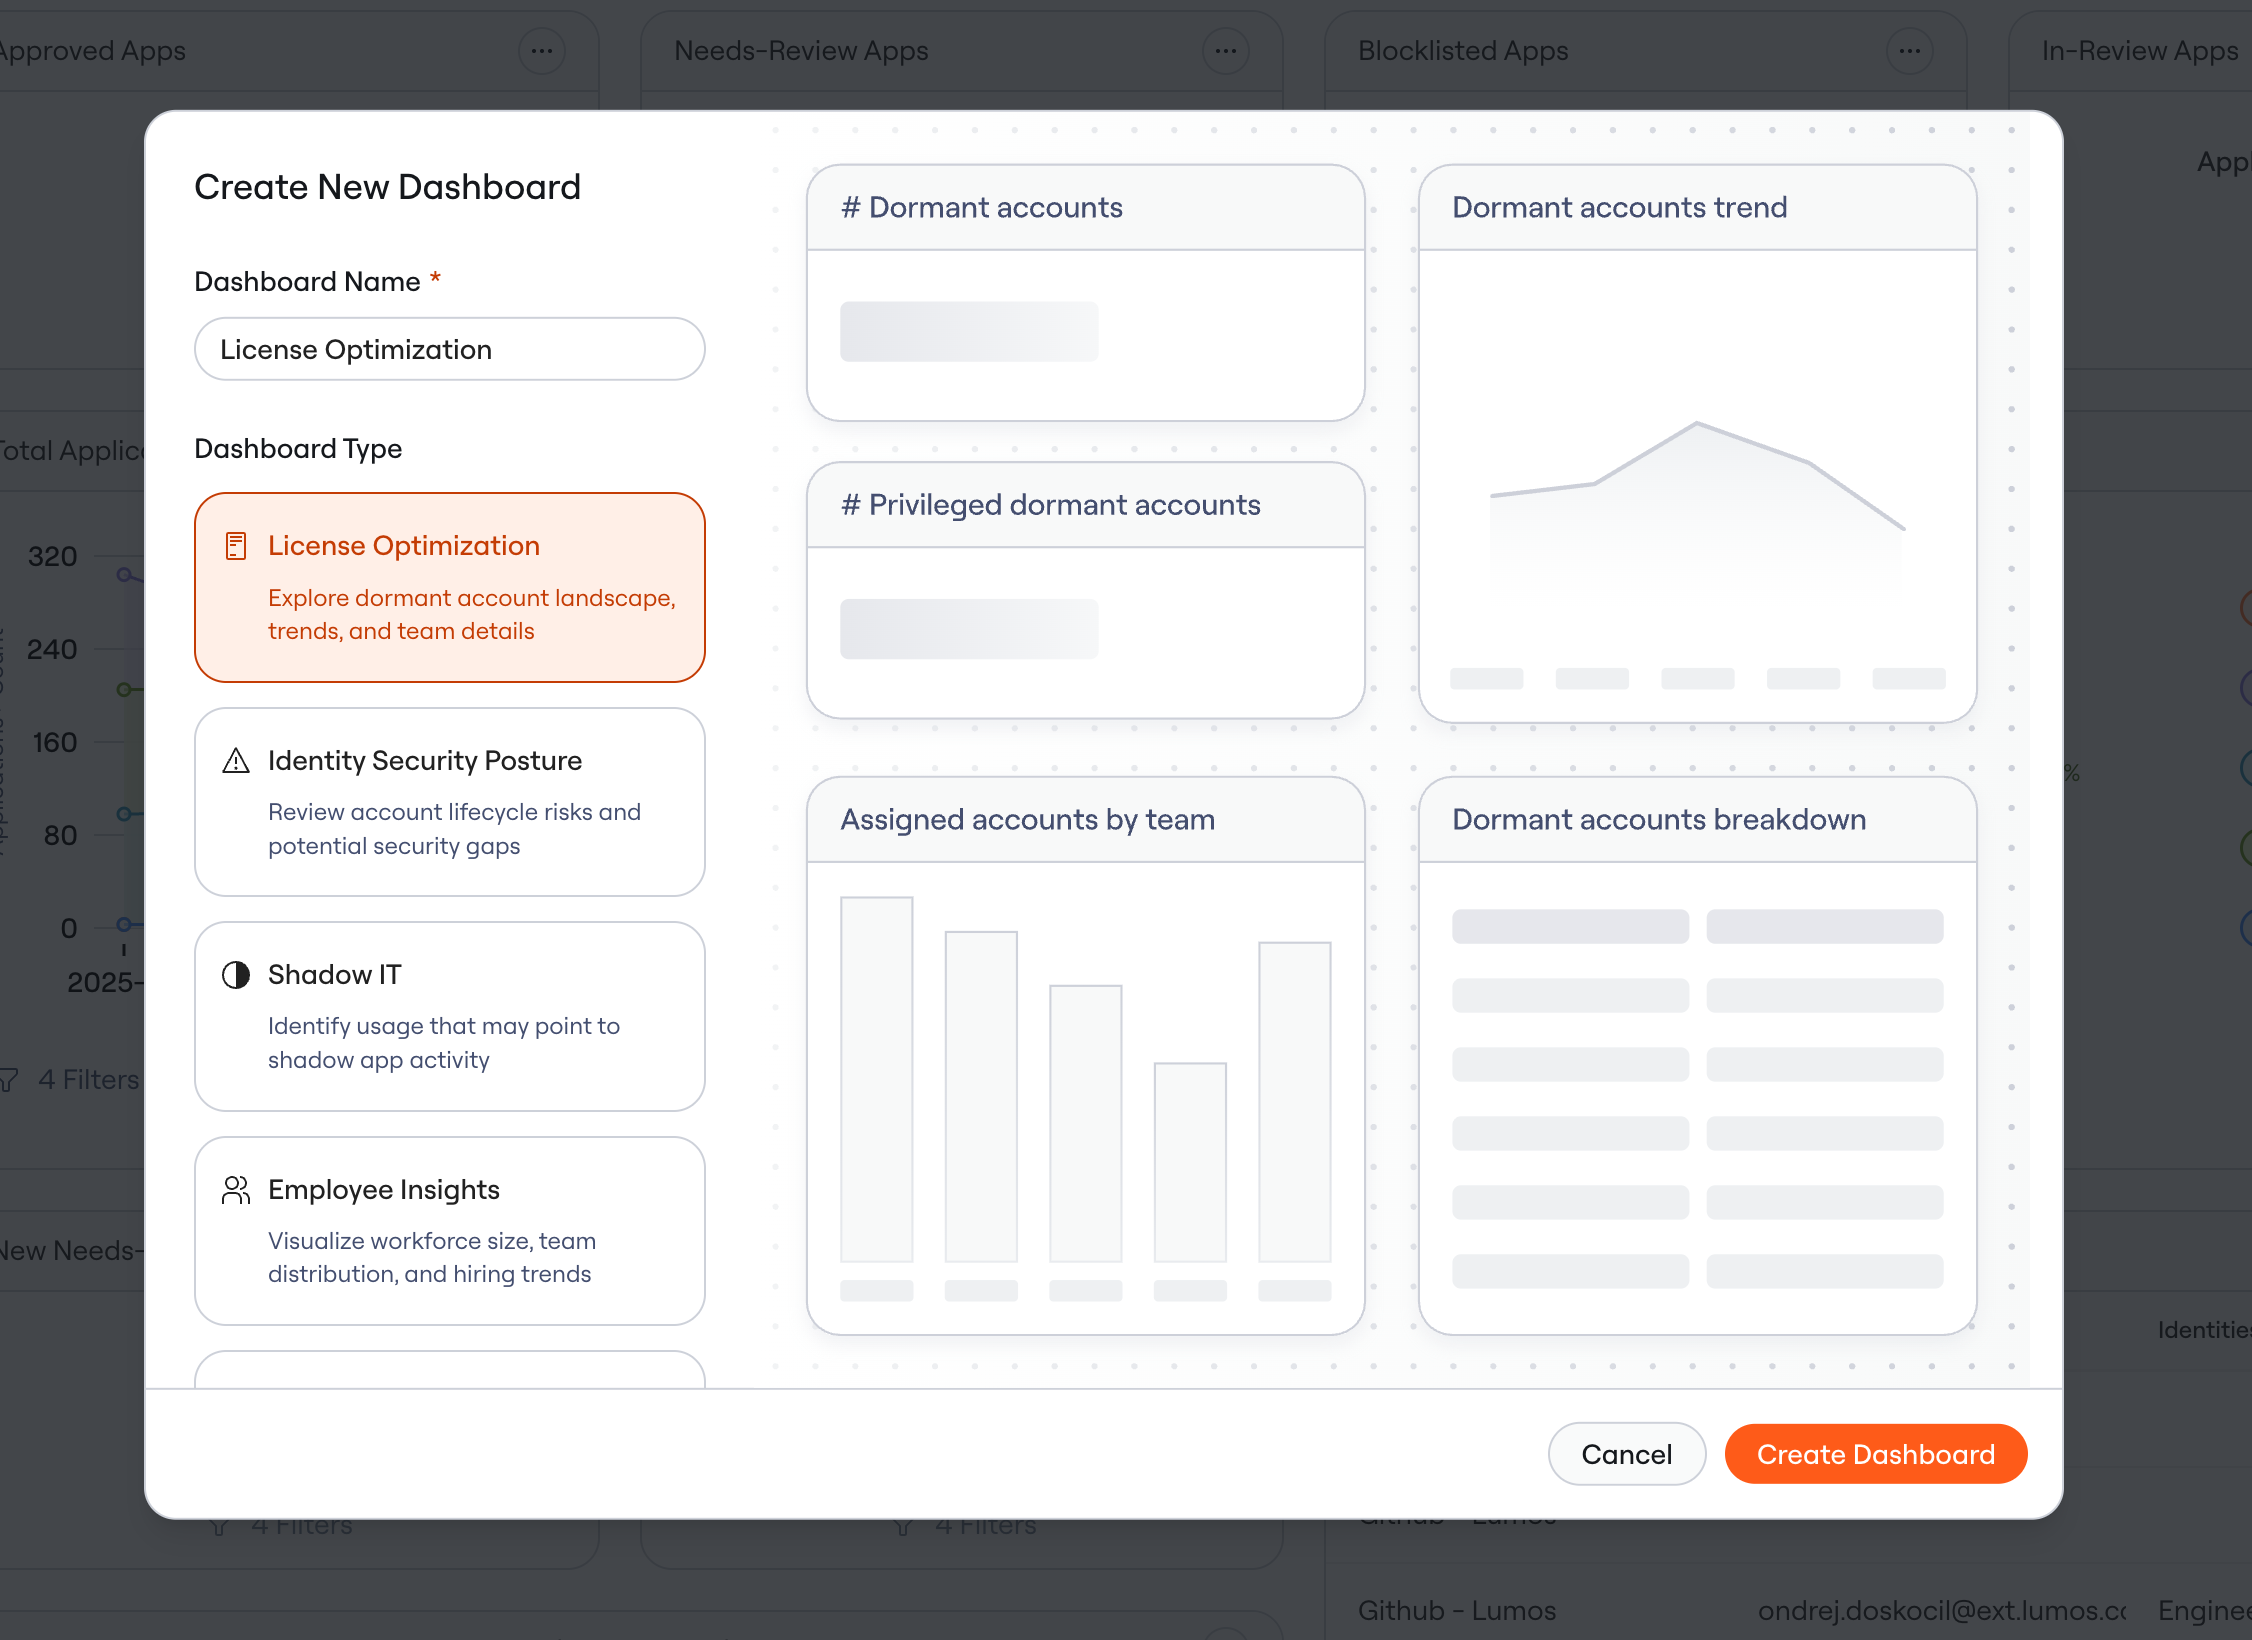
Start by exploring the Lumos templates, which populate with your organization's data.
### Choose Your First Template
Start with the template that matches your most pressing need:
* **Shadow IT**: Discover unmanaged applications, monitor blocklisted app usage, and adoption trends
* **Risk Management**: Review orphaned accounts, offboarding gaps, and privileged access patterns
* **License Optimization**: Identify unused licenses and savings opportunities
* **Employee Insights:** Visualize workforce size, team distribution, and hiring trends
**Note**: If you don't see the Analytics tab, verify your permissions with your Lumos administrator. By default, organization admins and readonly organization admins can access Analytics, but your admin can also share specific dashboards with you.
## Step 2: Start with Pre-Built Templates
Start by exploring the Lumos templates, which populate with your organization's data.
### Choose Your First Template
Start with the template that matches your most pressing need:
* **Shadow IT**: Discover unmanaged applications, monitor blocklisted app usage, and adoption trends
* **Risk Management**: Review orphaned accounts, offboarding gaps, and privileged access patterns
* **License Optimization**: Identify unused licenses and savings opportunities
* **Employee Insights:** Visualize workforce size, team distribution, and hiring trends
 ### Explore Your First Template
1. Click on **Shadow IT** (recommended starting point)
2. Watch as the dashboard populates with your actual application and user data
3. **Look for surprises** - these templates often reveal insights you hadn't noticed before
### Explore Your First Template
1. Click on **Shadow IT** (recommended starting point)
2. Watch as the dashboard populates with your actual application and user data
3. **Look for surprises** - these templates often reveal insights you hadn't noticed before
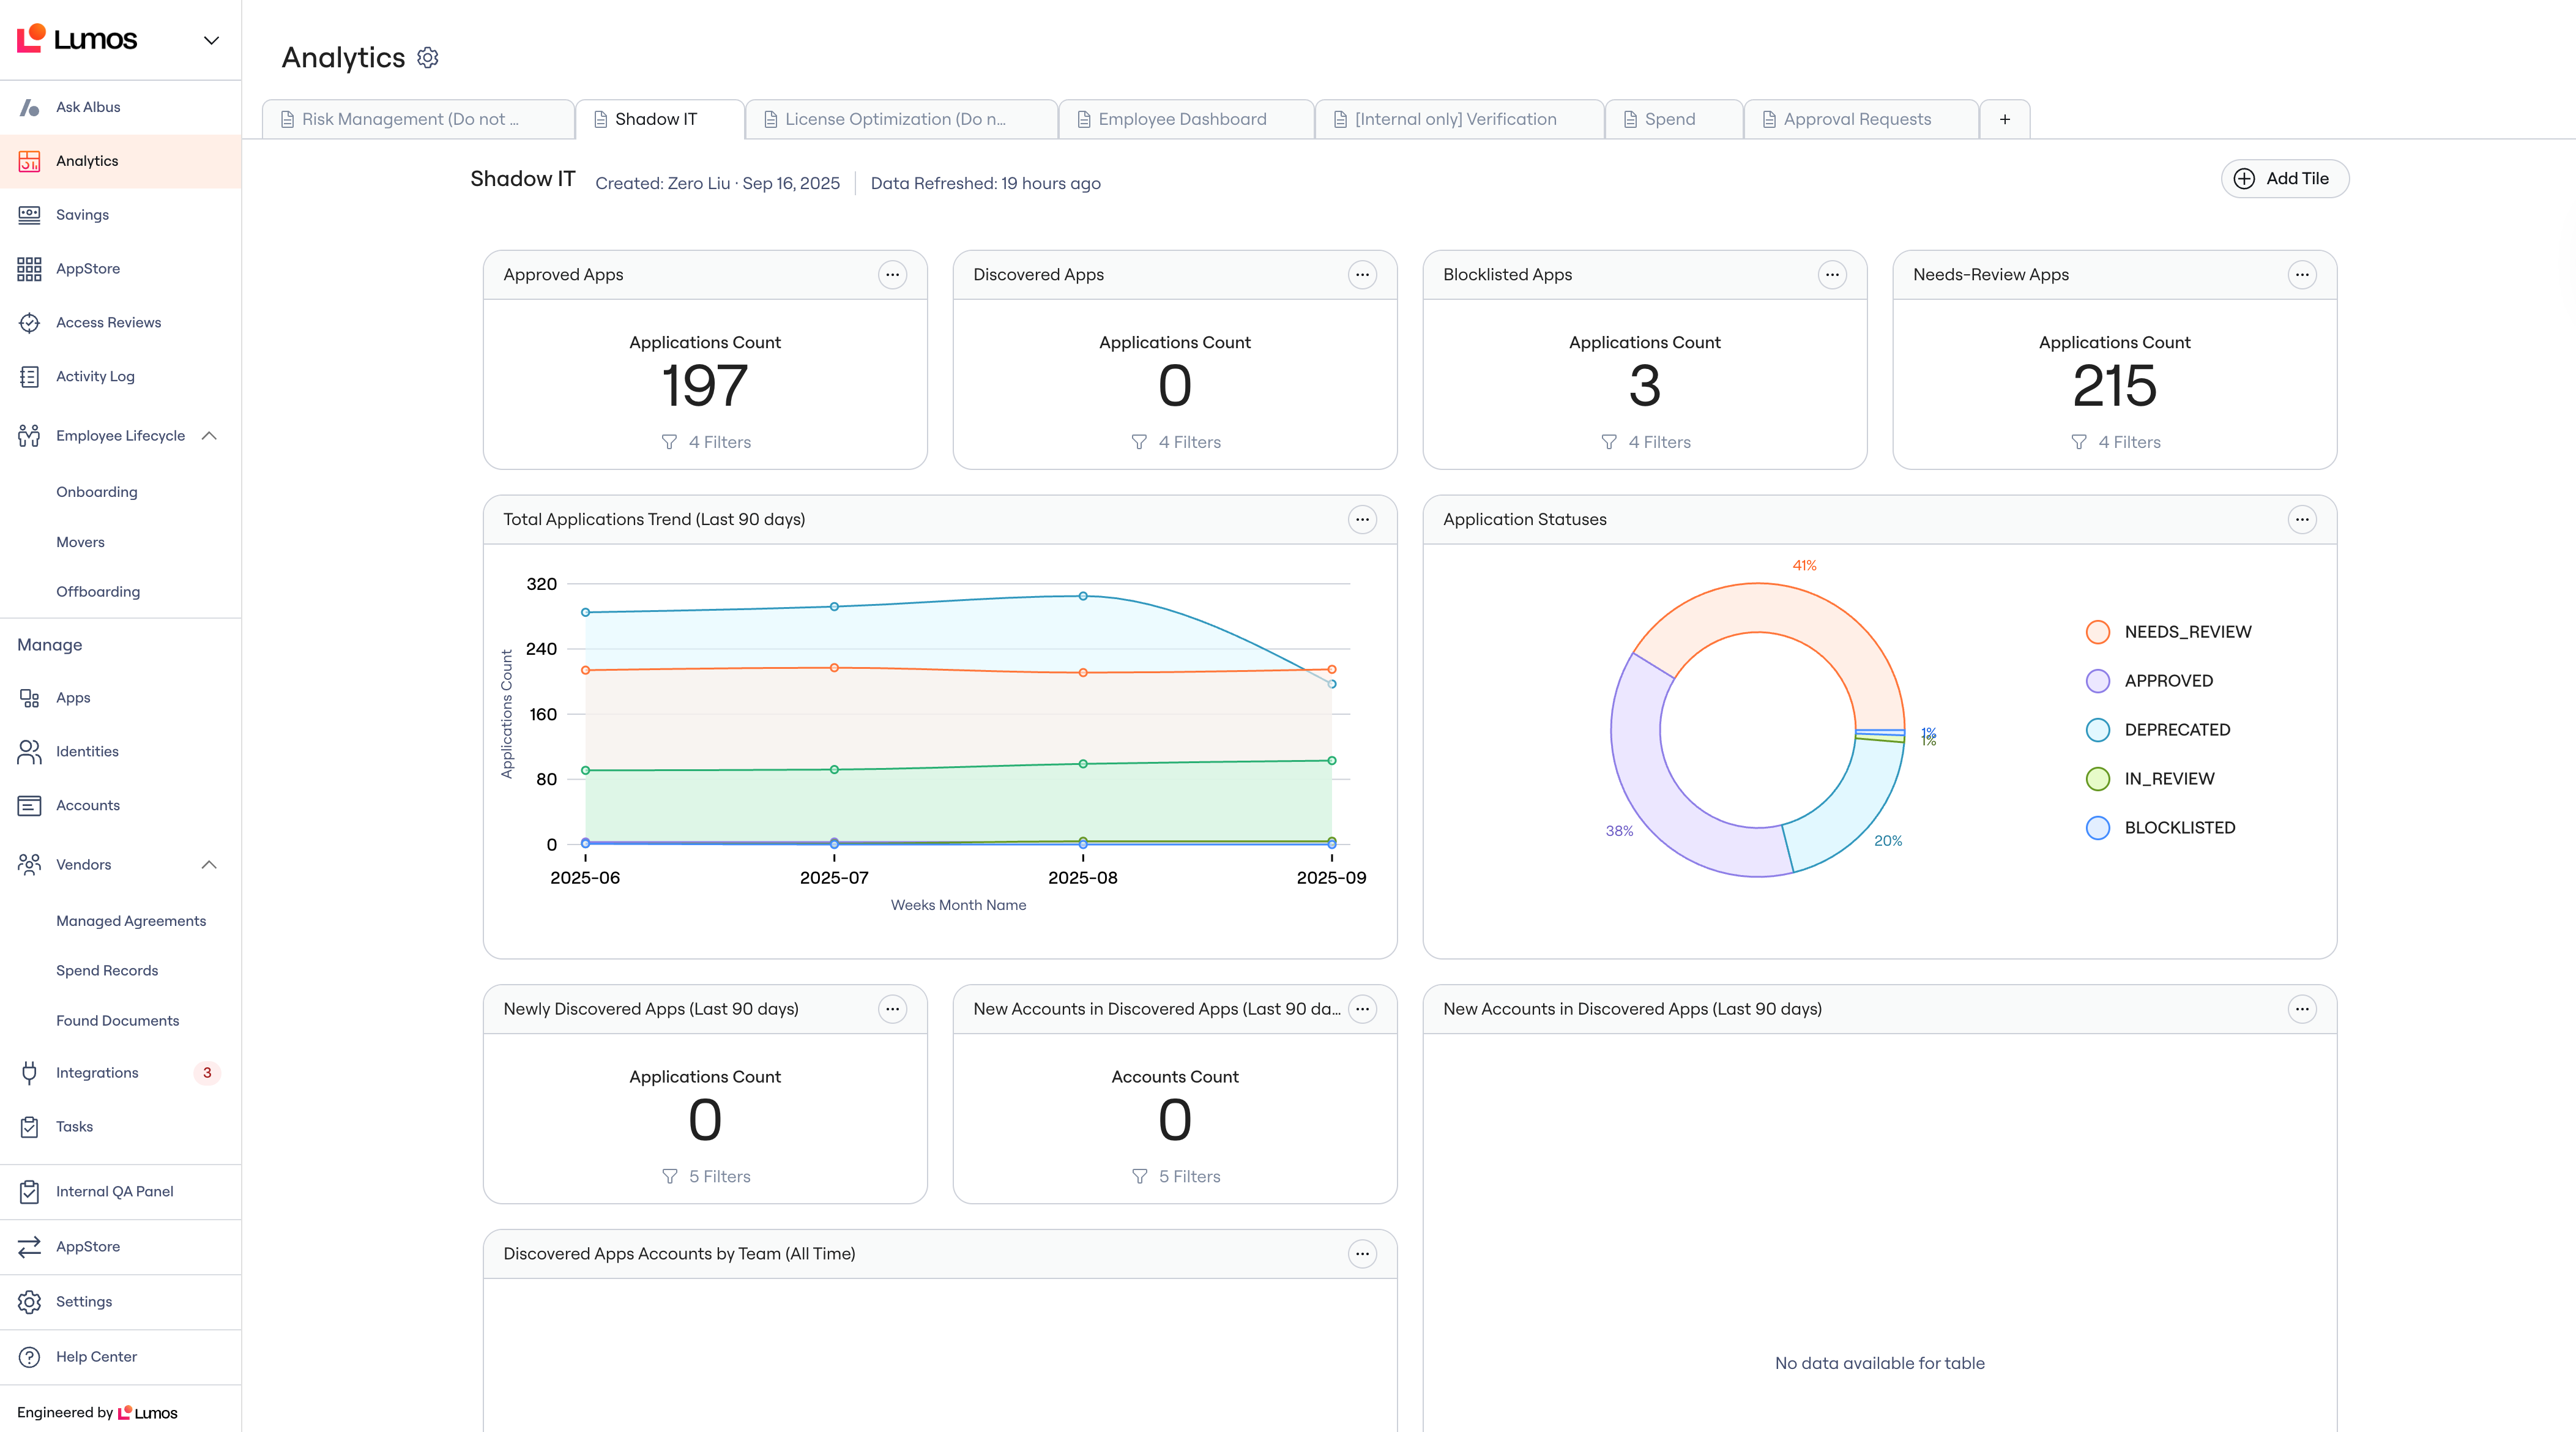 **Key Insight Moment**: Many admins discover applications they didn't know existed or realize the blocklisted apps are still being accessed. This is your "aha moment" - you're seeing your environment in a new way.
### Verify and Explore Your Data
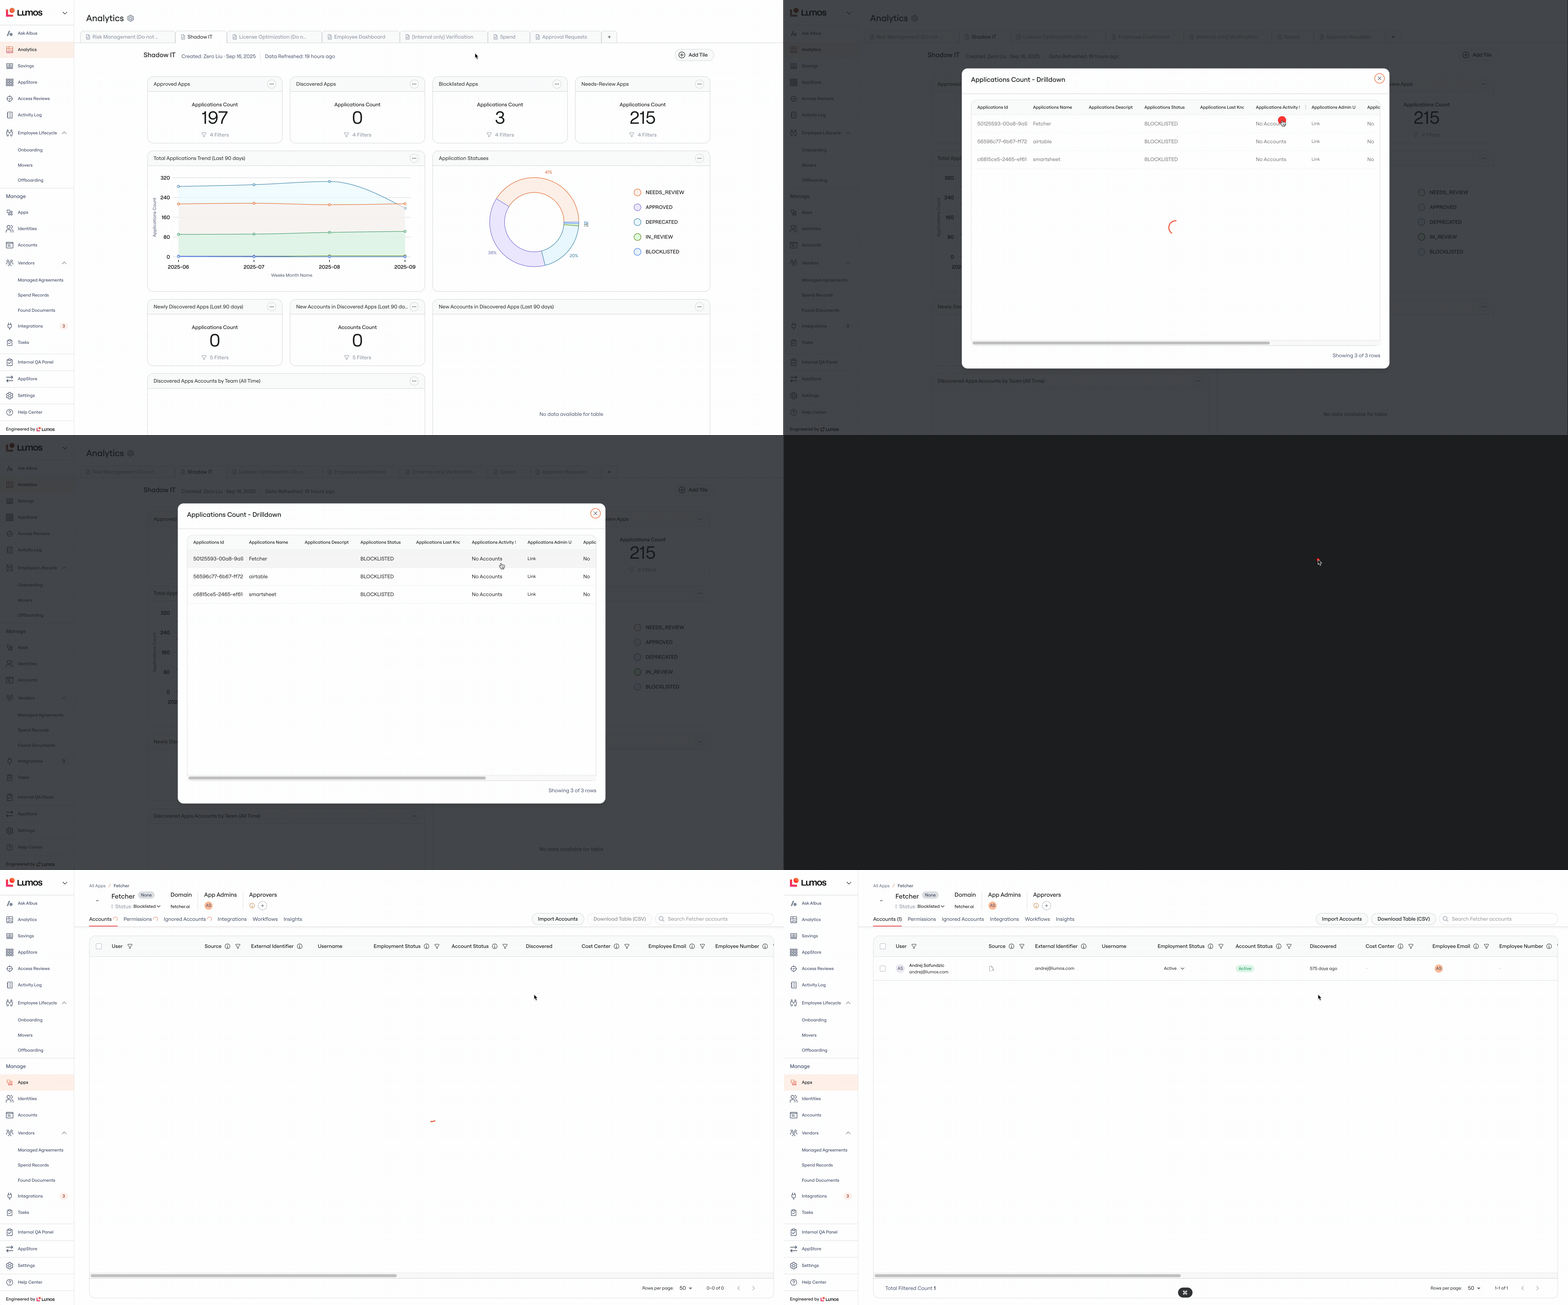
1. Click on any chart segment to drill down into the underlying applications
2. Use the **Admin URL** link to see the raw data behind any visualization
3. Apply filters to focus on specific teams, time periods, or applications
This verification step builds confidence that the dashboard numbers align with your understanding of the environment.
**Key Insight Moment**: Many admins discover applications they didn't know existed or realize the blocklisted apps are still being accessed. This is your "aha moment" - you're seeing your environment in a new way.
### Verify and Explore Your Data
1. Click on any chart segment to drill down into the underlying applications
2. Use the **Admin URL** link to see the raw data behind any visualization
3. Apply filters to focus on specific teams, time periods, or applications
This verification step builds confidence that the dashboard numbers align with your understanding of the environment.
 ## Step 3: Customize for Your Workflows
Once you've explored the templates, tailor them for your specific needs:
### Filtering for Relevance
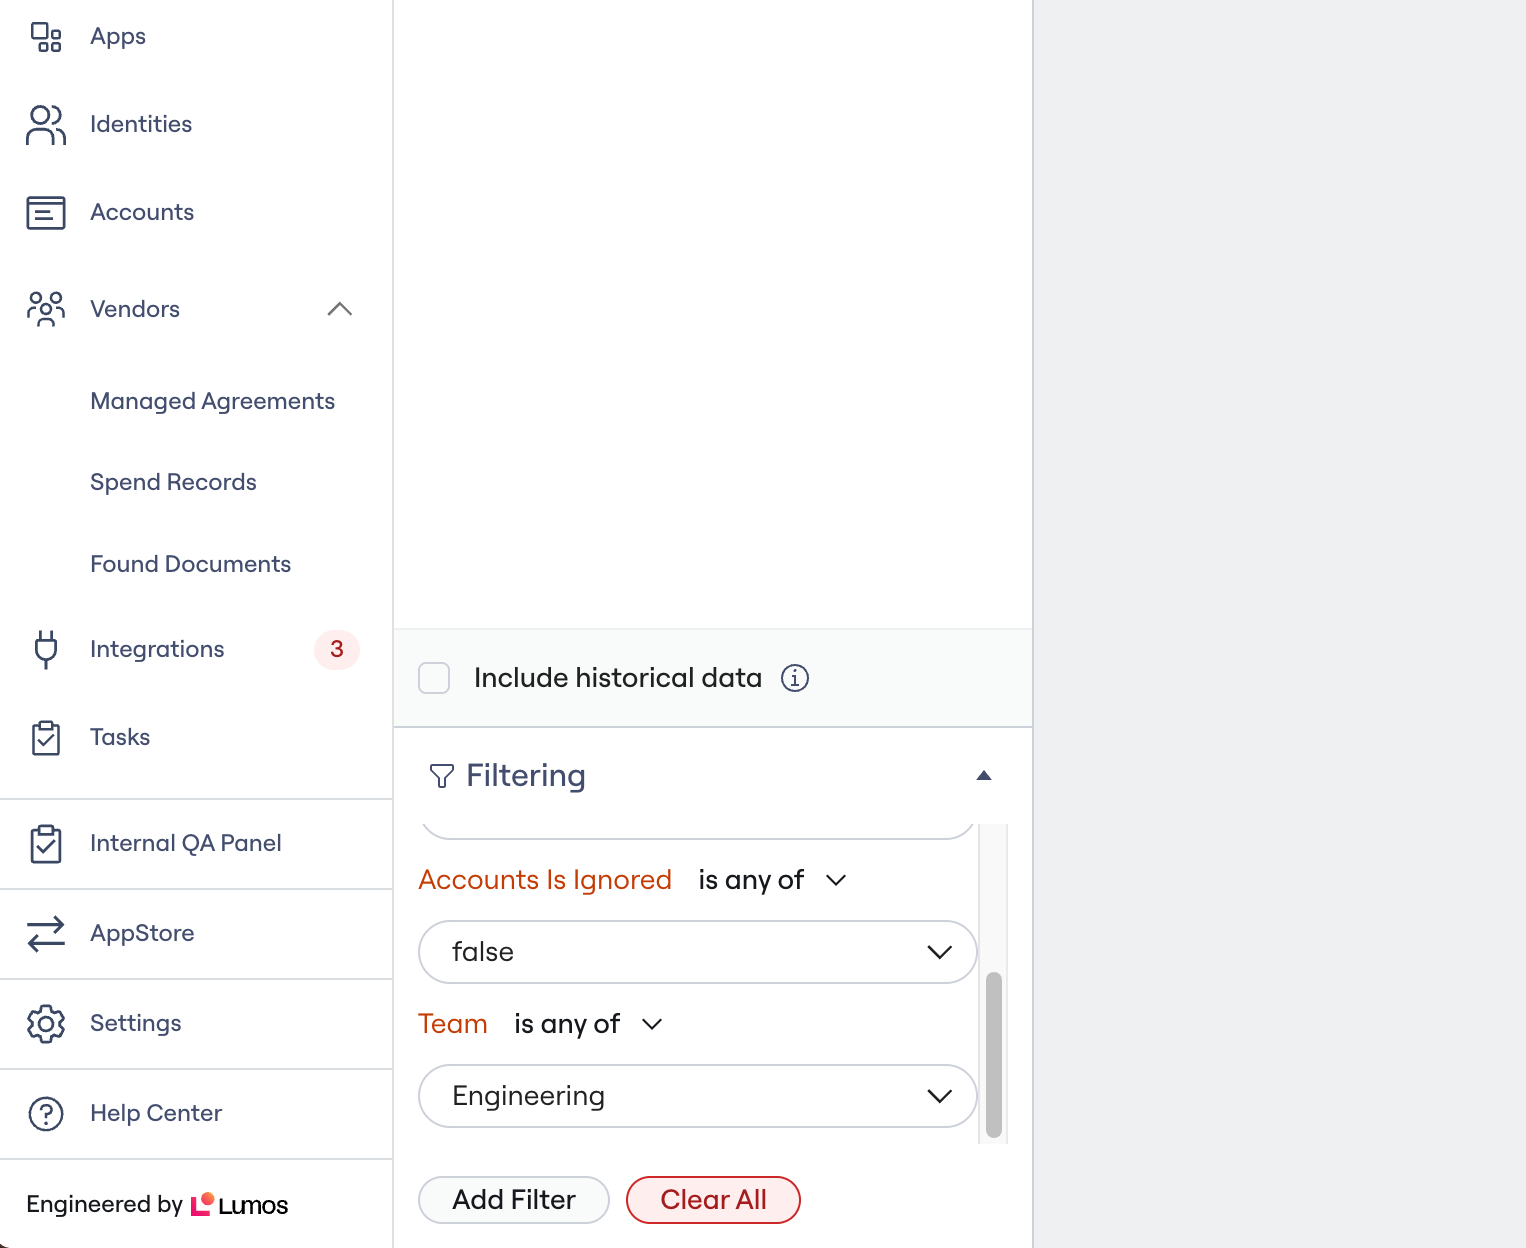
1. Edit **Approved Apps** KPI tile
2. Use the **Team** filter to create views specific to different teams
3. Apply **Discovered At** filters to focus on recent changes or historical trends
4. Filter out ignored applications or other irrelevant data
## Step 3: Customize for Your Workflows
Once you've explored the templates, tailor them for your specific needs:
### Filtering for Relevance
1. Edit **Approved Apps** KPI tile
2. Use the **Team** filter to create views specific to different teams
3. Apply **Discovered At** filters to focus on recent changes or historical trends
4. Filter out ignored applications or other irrelevant data
 ### Saving Custom Views
1. After applying filters and customizations, click **Save Changes**
2. Give it a descriptive name like "Engineering Team Recent Approved Apps"
## Step 4: Share with Stakeholders
Transform how you communicate insights to leadership and department heads with granular sharing controls:
### Sharing Individual Dashboards
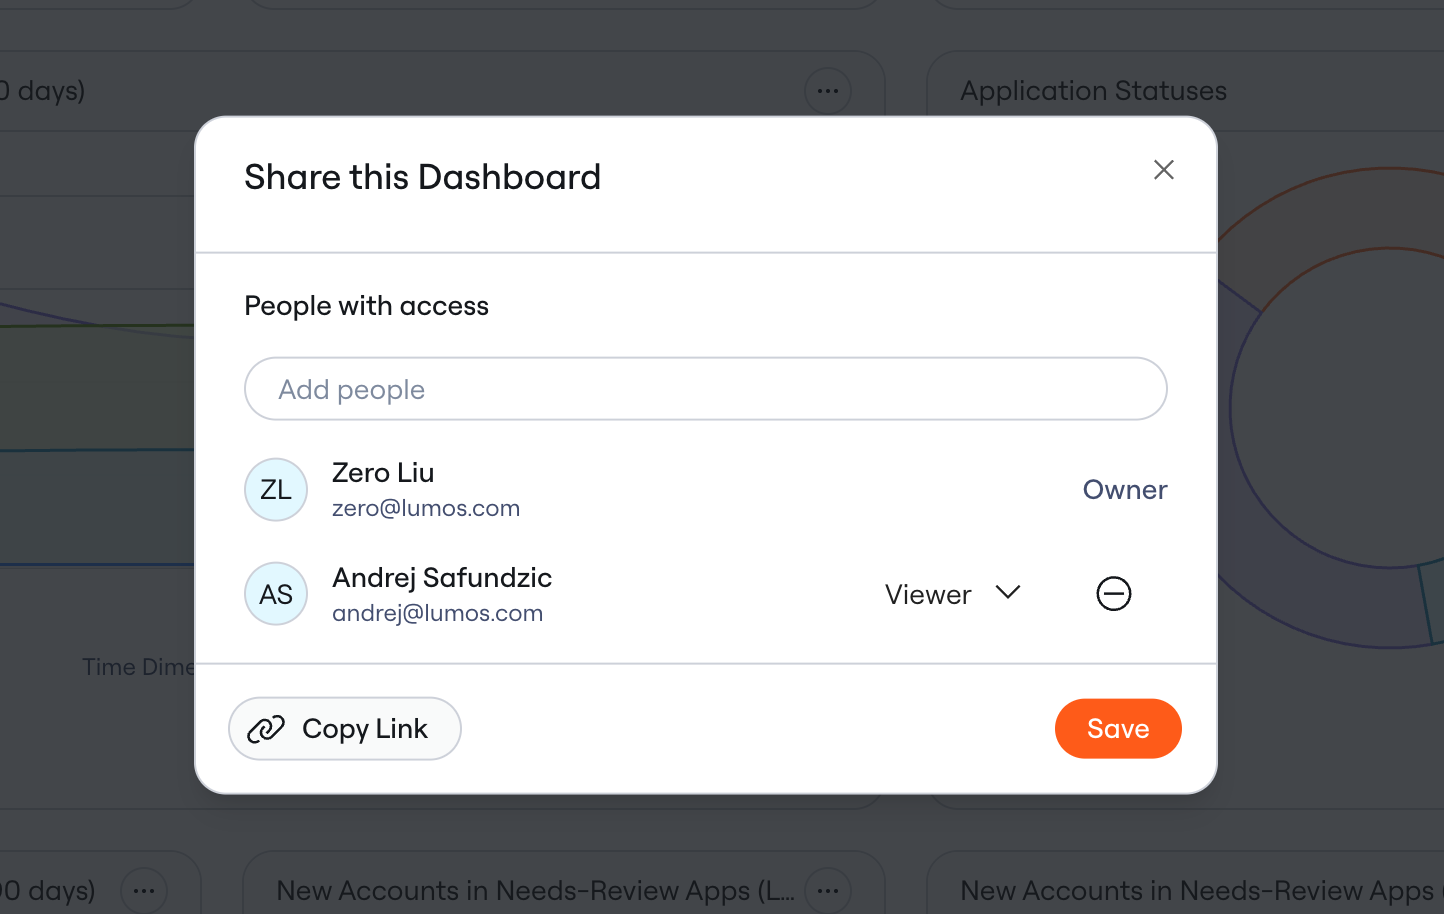
1. Open the dashboard you want to share
2. Click the **Share** icon in the top right
3. Add team members by email or name
4. Choose permission level:
1. **Can view**: Recipients can see the dashboard and interact with filters, but cannot edit
2. **Can edit**: Recipients can modify the dashboard, add/remove tiles, and change configurations
5. Click **Share**
### Saving Custom Views
1. After applying filters and customizations, click **Save Changes**
2. Give it a descriptive name like "Engineering Team Recent Approved Apps"
## Step 4: Share with Stakeholders
Transform how you communicate insights to leadership and department heads with granular sharing controls:
### Sharing Individual Dashboards
1. Open the dashboard you want to share
2. Click the **Share** icon in the top right
3. Add team members by email or name
4. Choose permission level:
1. **Can view**: Recipients can see the dashboard and interact with filters, but cannot edit
2. **Can edit**: Recipients can modify the dashboard, add/remove tiles, and change configurations
5. Click **Share**
 Important: Dashboards are private by default. Only people you explicitly share with can access them. Non-admin users can view shared dashboards without requiring full admin privileges.
## Sharing Via URL
After sharing a dashboard with appropriate permissions, copy the dashboard URL. Send it to relevant stakeholders who already have access. Recipients will see the live dashboard when they click the link.
### Setting Up Recurring Reviews
**Recommended workflow**: Schedule monthly review meetings where you:
* Present key metrics from your dashboards
* Identify actionable items (orphaned accounts to clean up, risky applications to review)
* Track improvement over time using historical trend data
* Share specific dashboard links for department heads to monitor their teams
## Step 5: Export Your Data
Get your data out of Lumos for external analysis, presentations, or integration with other tools:
### Export Charts to CSV
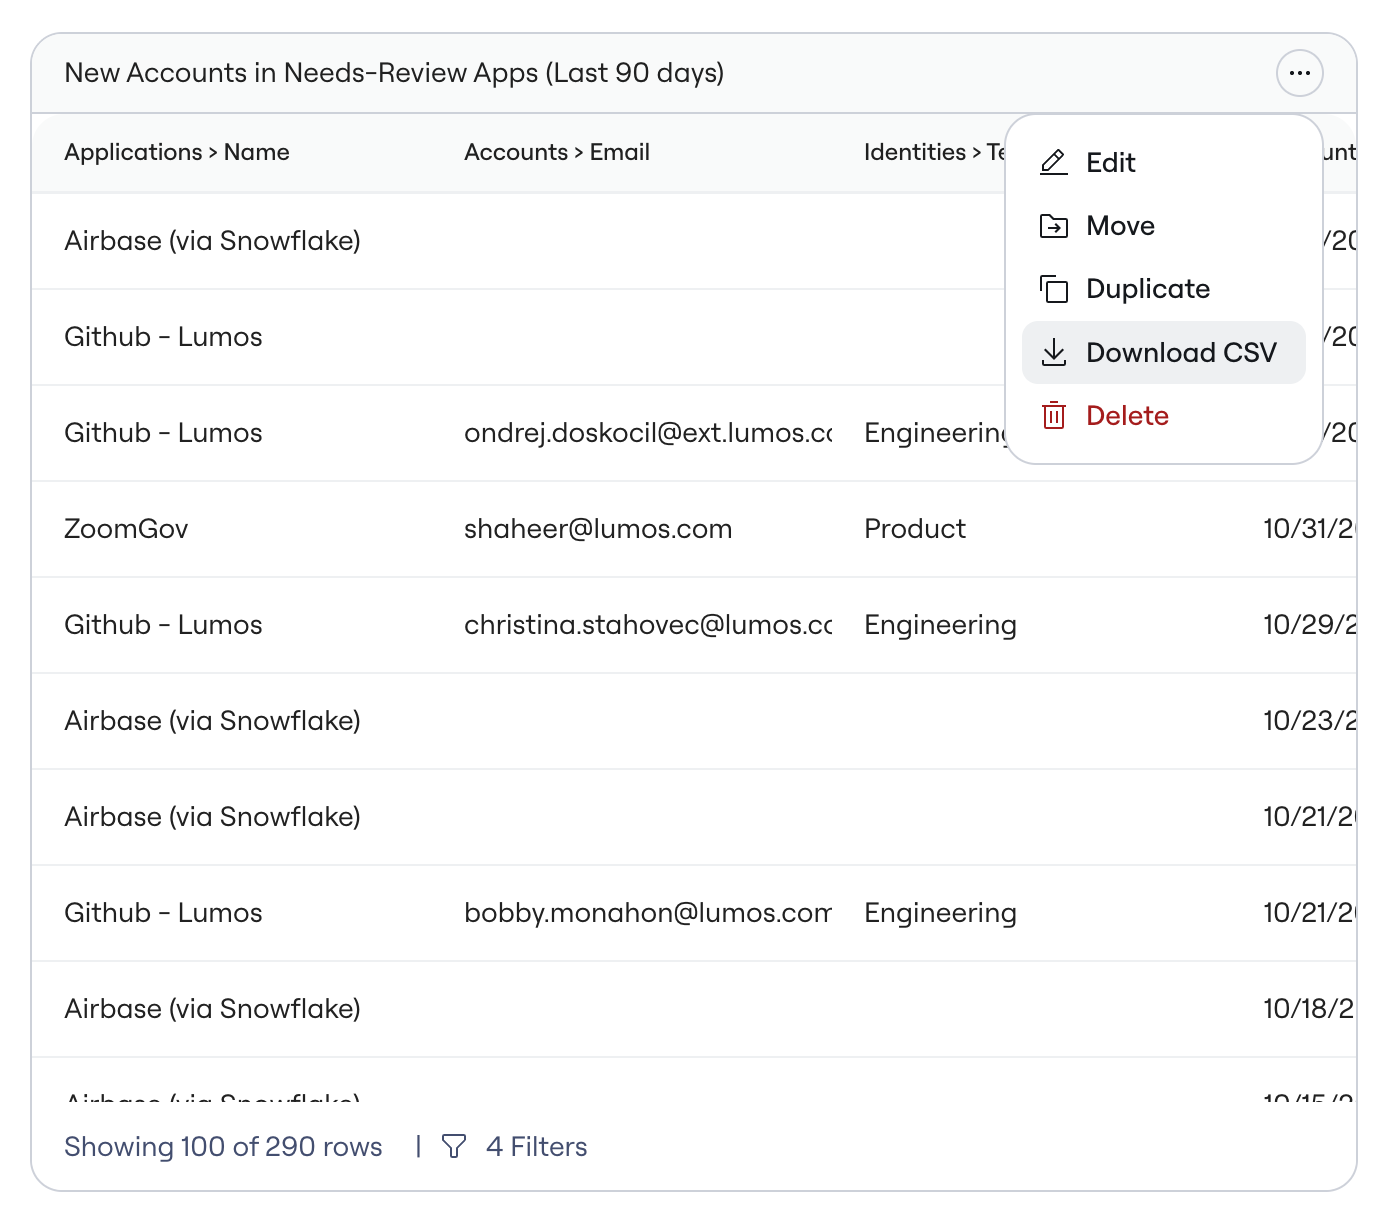
1. Click on any chart (horizontal bar, vertical bar, line, area, or pie chart)
2. Click the **Export** icon in the chart header
3. Your CSV download will begin automatically
All exports respect your active filters and date ranges, giving you exactly the data you need.
Important: Dashboards are private by default. Only people you explicitly share with can access them. Non-admin users can view shared dashboards without requiring full admin privileges.
## Sharing Via URL
After sharing a dashboard with appropriate permissions, copy the dashboard URL. Send it to relevant stakeholders who already have access. Recipients will see the live dashboard when they click the link.
### Setting Up Recurring Reviews
**Recommended workflow**: Schedule monthly review meetings where you:
* Present key metrics from your dashboards
* Identify actionable items (orphaned accounts to clean up, risky applications to review)
* Track improvement over time using historical trend data
* Share specific dashboard links for department heads to monitor their teams
## Step 5: Export Your Data
Get your data out of Lumos for external analysis, presentations, or integration with other tools:
### Export Charts to CSV
1. Click on any chart (horizontal bar, vertical bar, line, area, or pie chart)
2. Click the **Export** icon in the chart header
3. Your CSV download will begin automatically
All exports respect your active filters and date ranges, giving you exactly the data you need.
 ### Export Drill-Down Tables
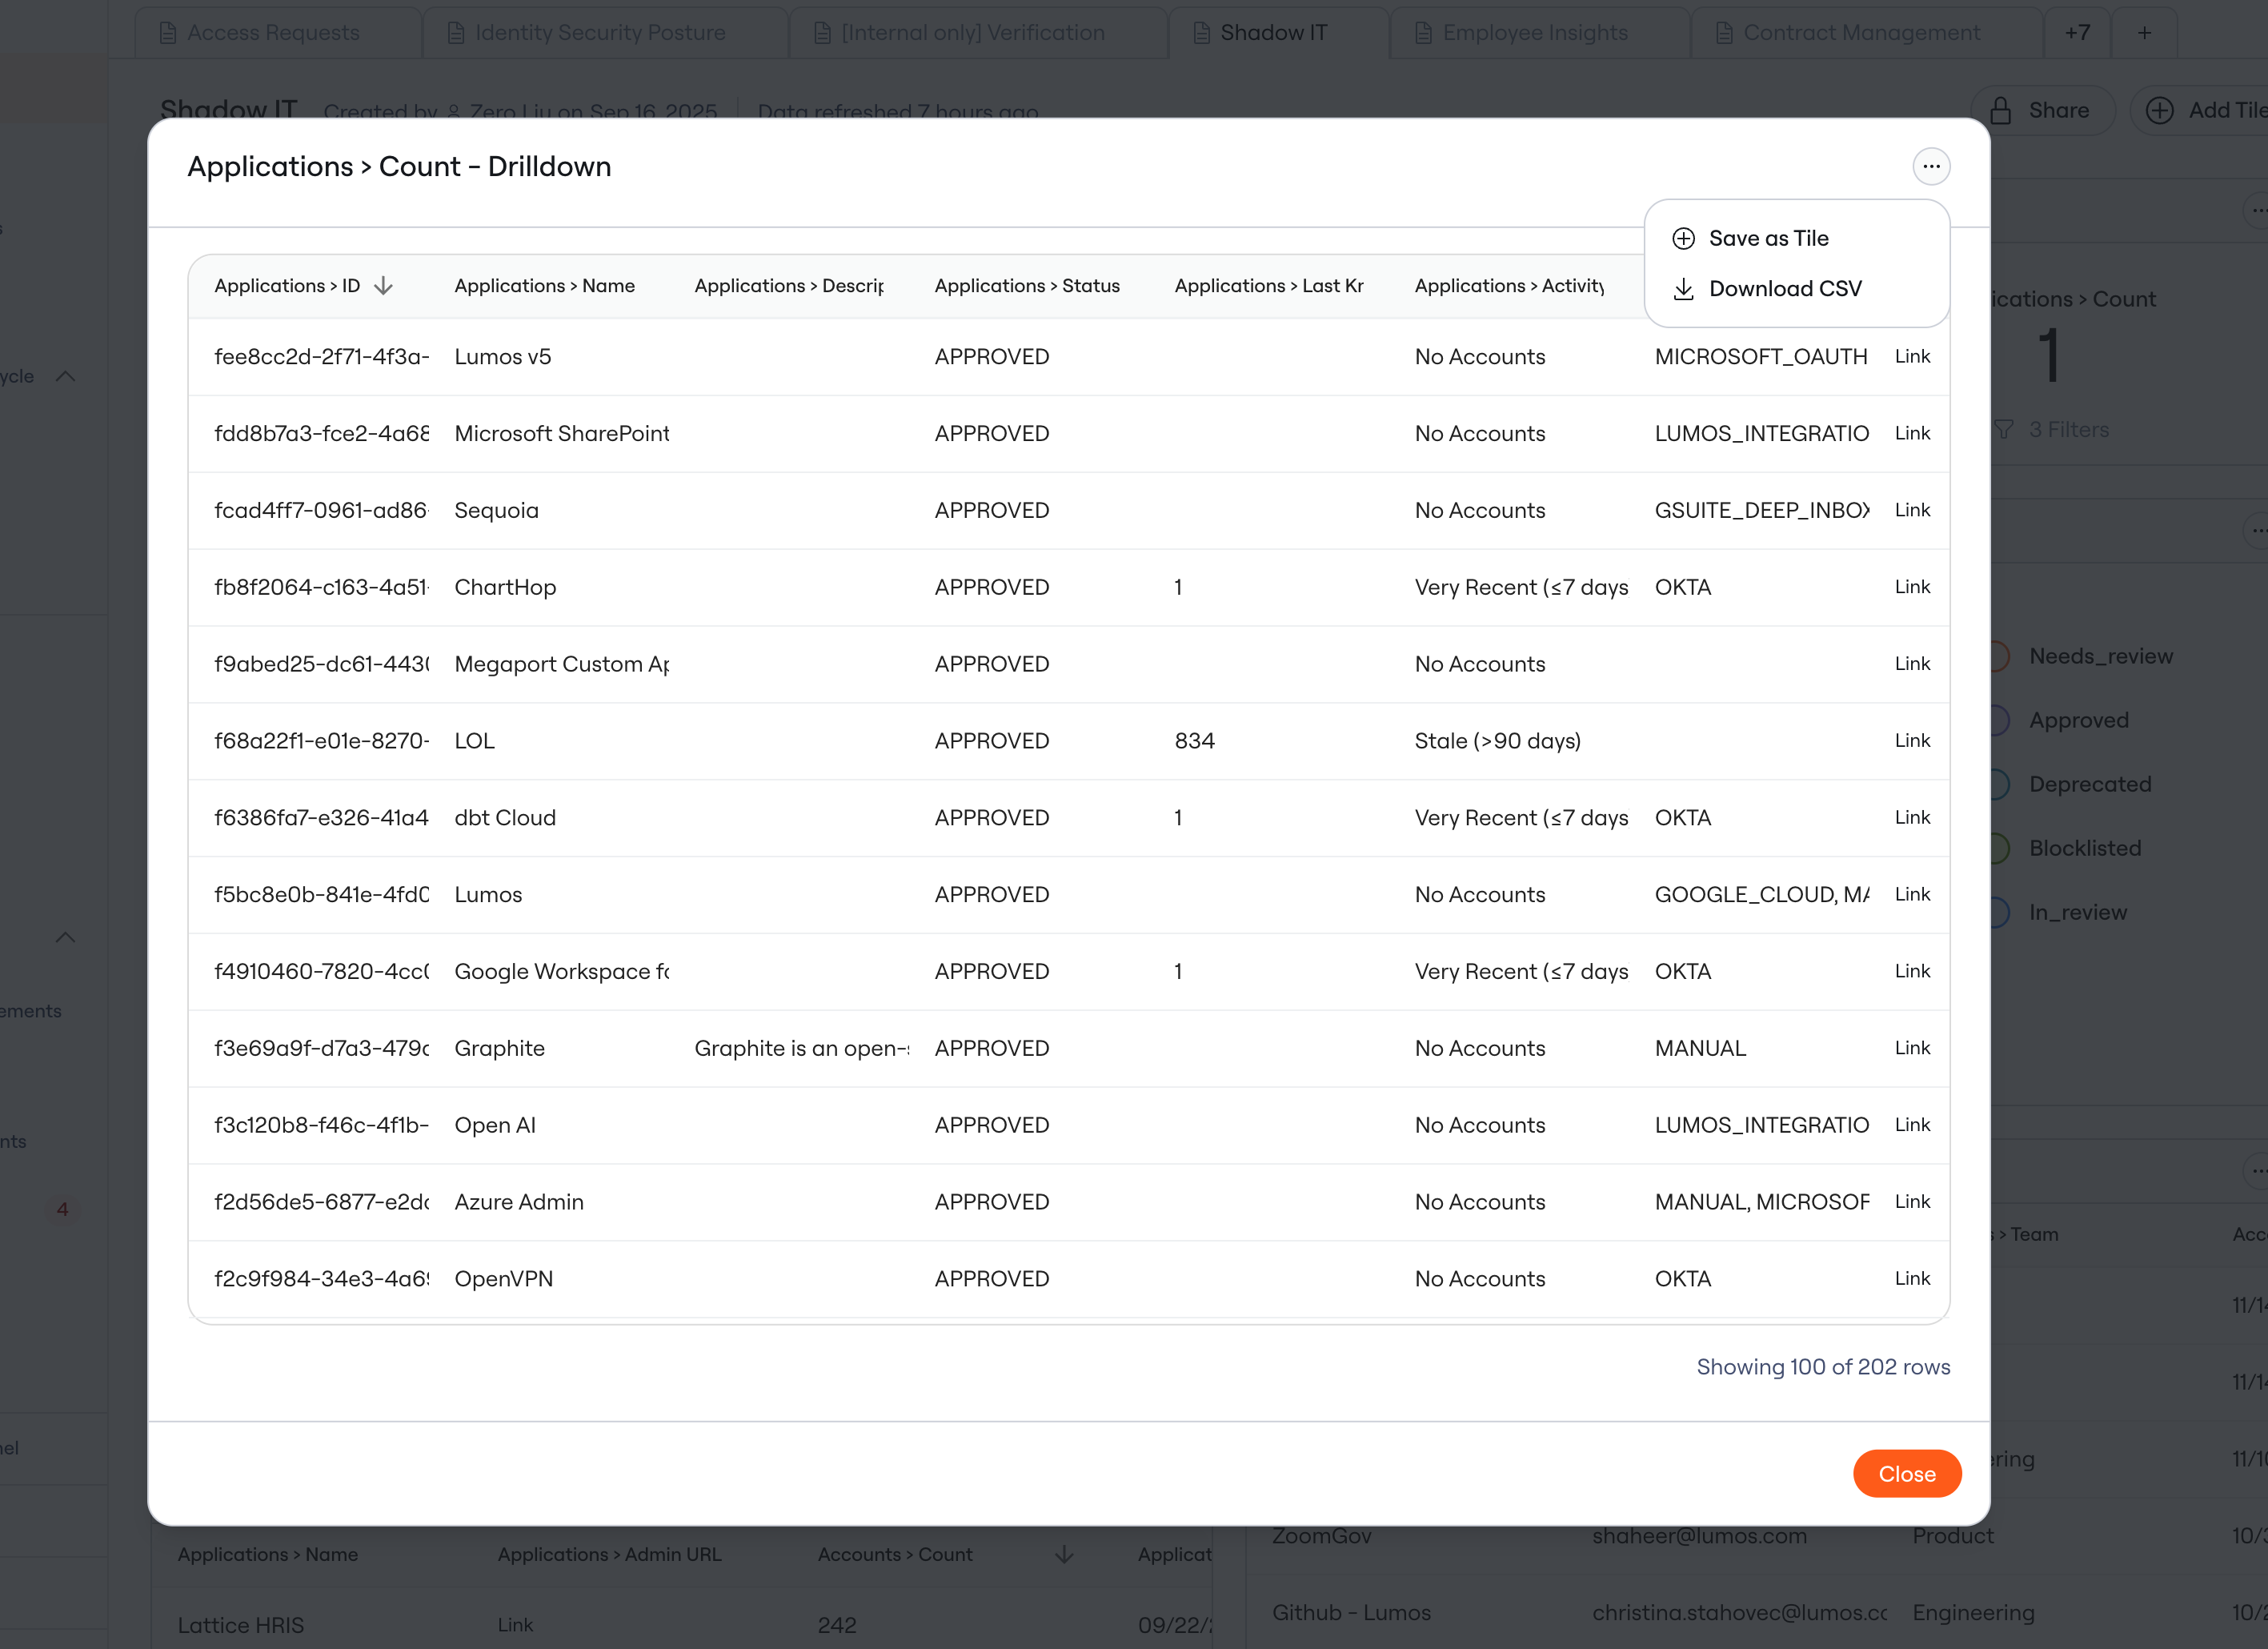
1. Click into any chart data point to see the underlying records
2. Apply any additional filters or sorting you need
3. Click the **Export** icon to download the drill-down table as CSV
4. The export maintains all filters and sorting you've applied
### Export Drill-Down Tables
1. Click into any chart data point to see the underlying records
2. Apply any additional filters or sorting you need
3. Click the **Export** icon to download the drill-down table as CSV
4. The export maintains all filters and sorting you've applied
 ## Step 6: Build Custom Dashboards (Advanced)
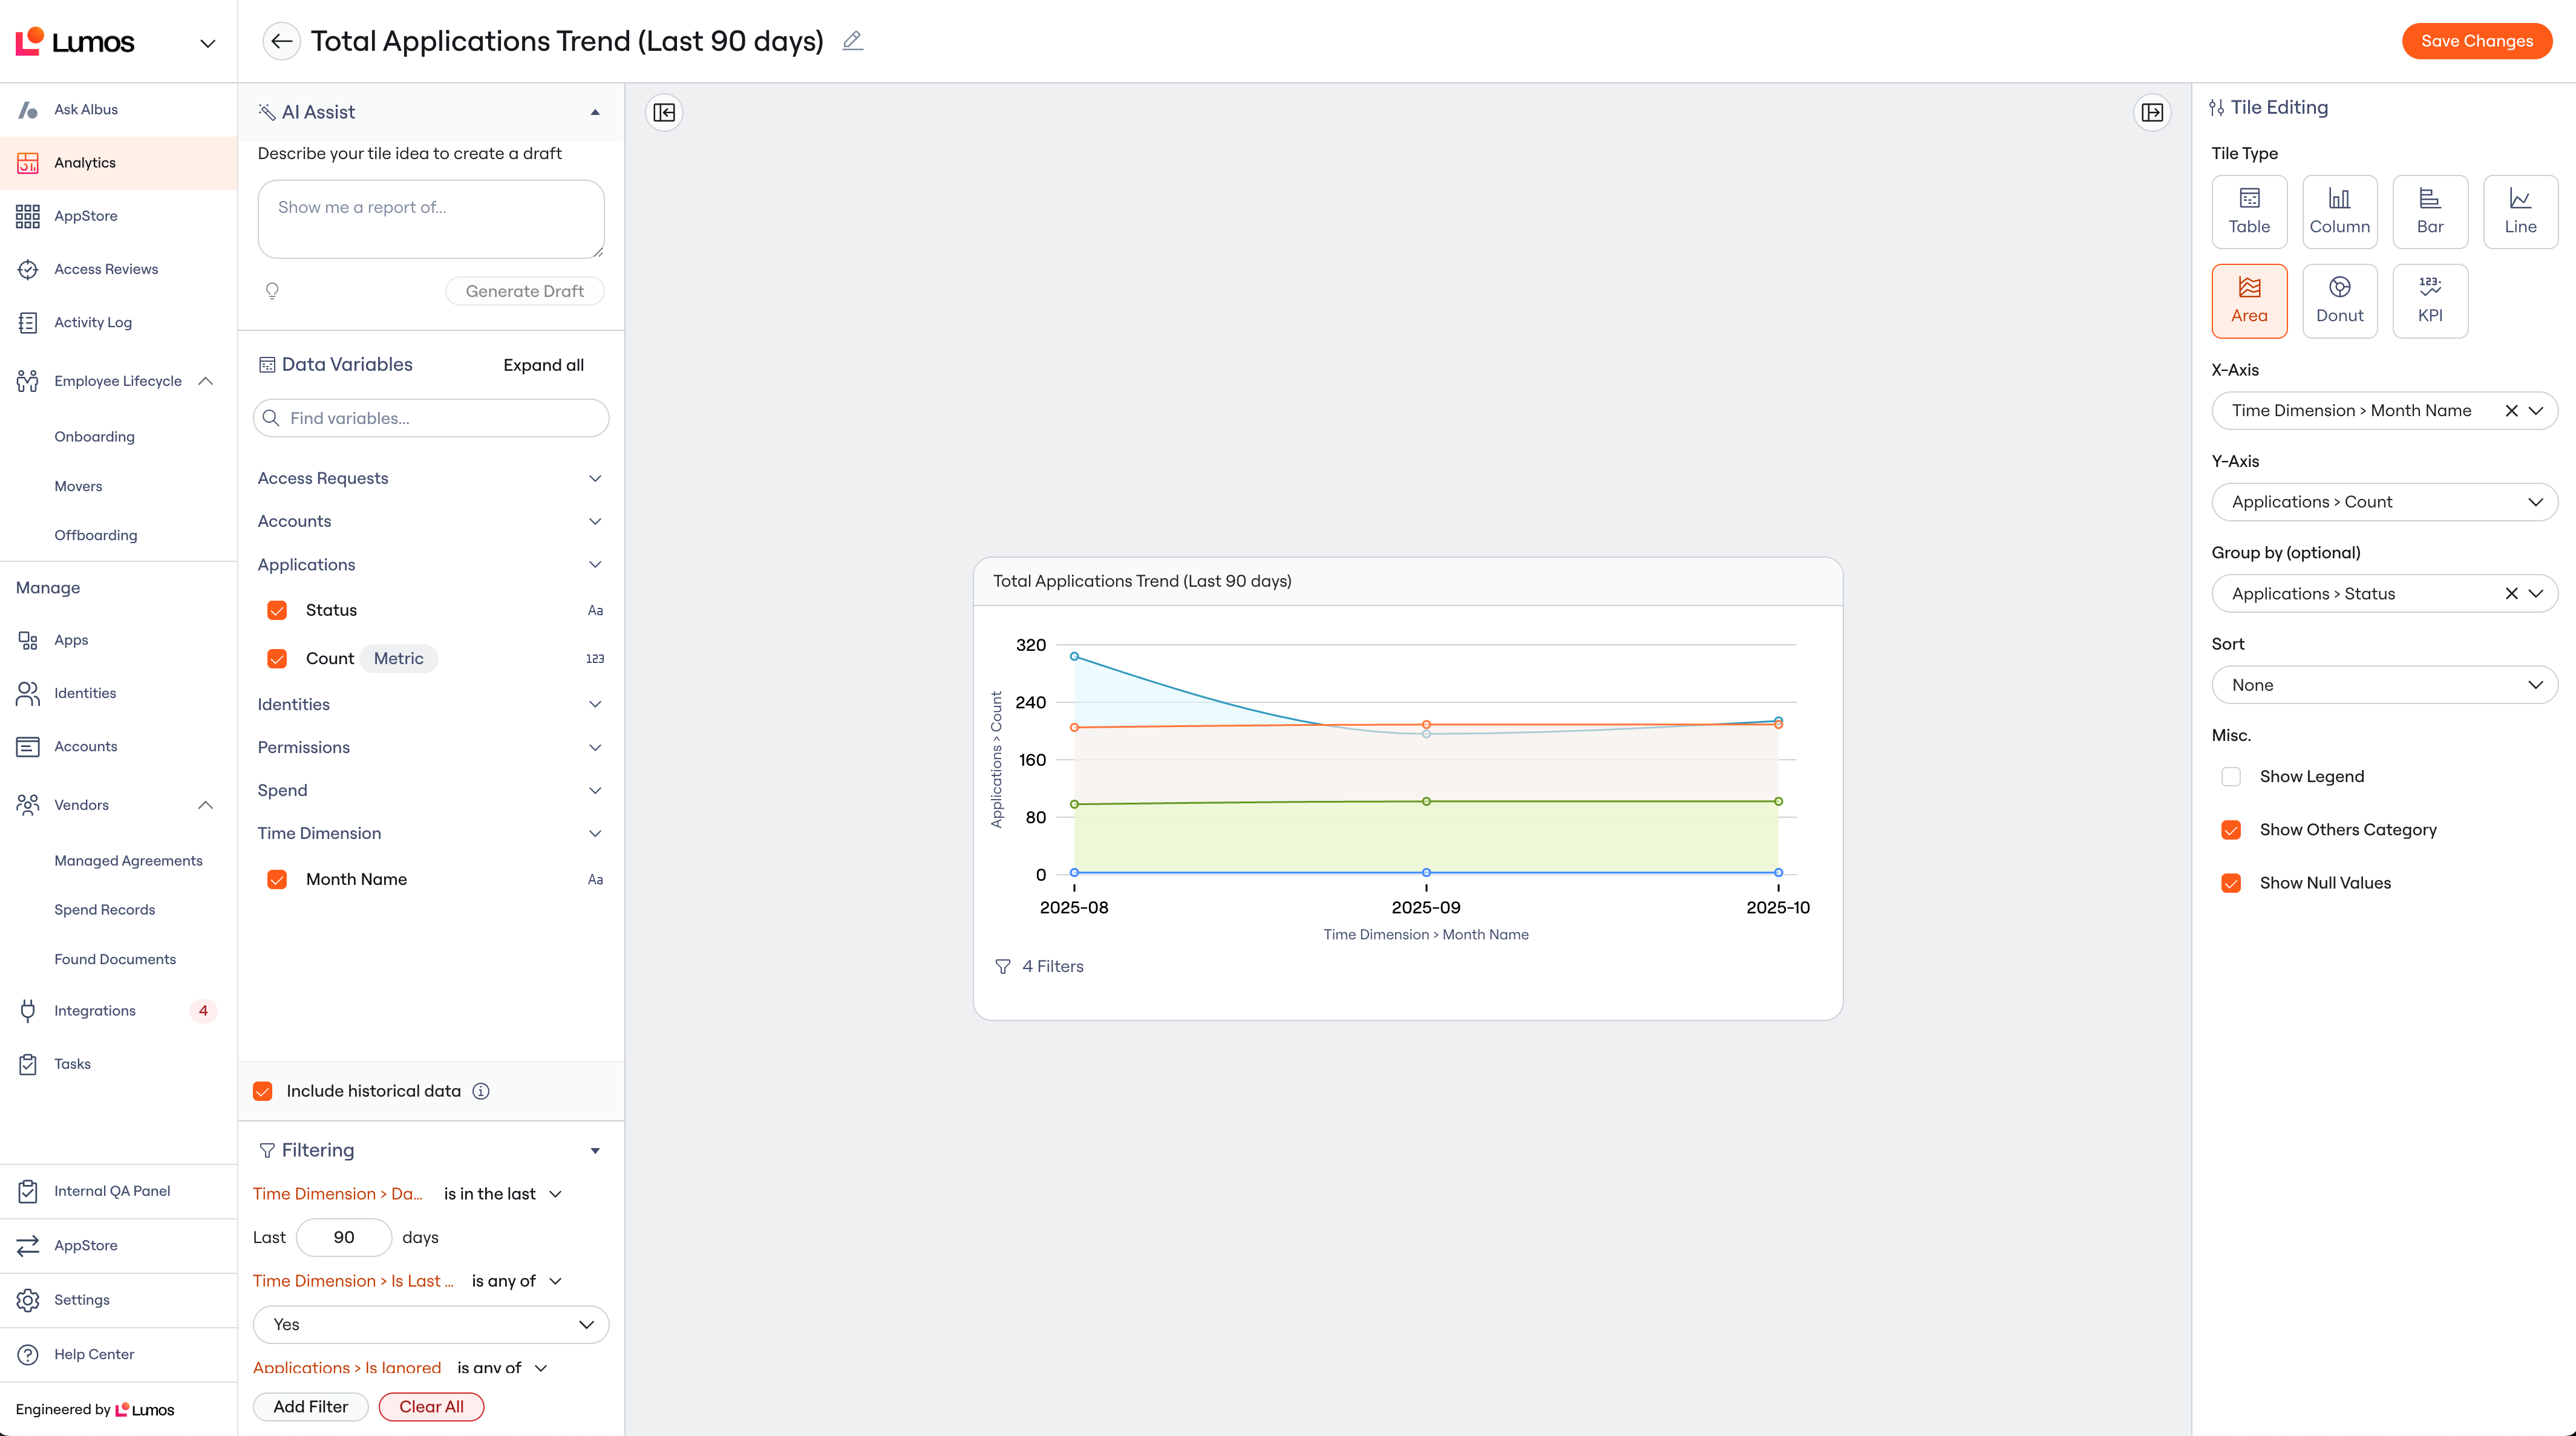
To create a fully custom dashboard, use the dashboard builder:
### Manual Chart Creation
1. Click **Create New Dashboard**
2. Add charts using the **+ Add Tile** button
3. Select your data source (Applications, Identities, Accounts, etc.)
4. Choose visualization type (Bar Chart, Pie Chart, Table, KPI Tile)
5. Configure filters and groupings to show exactly what you need
### AI-Powered Chart Building
For quick custom insights, use the AI assistant:
In the **AI Assistant** section, type natural language queries like:
* "Show me applications ranked by user count in a table"
* "How are terminated user accounts trending over the last three months"
* "Display who owns most privileged accounts in bar chart"
**Important**: The AI assistant is in early alpha. Always verify the dimensions, metrics, and filters it selects. Use it as a starting point, then refine manually as needed.
## Step 6: Build Custom Dashboards (Advanced)
To create a fully custom dashboard, use the dashboard builder:
### Manual Chart Creation
1. Click **Create New Dashboard**
2. Add charts using the **+ Add Tile** button
3. Select your data source (Applications, Identities, Accounts, etc.)
4. Choose visualization type (Bar Chart, Pie Chart, Table, KPI Tile)
5. Configure filters and groupings to show exactly what you need
### AI-Powered Chart Building
For quick custom insights, use the AI assistant:
In the **AI Assistant** section, type natural language queries like:
* "Show me applications ranked by user count in a table"
* "How are terminated user accounts trending over the last three months"
* "Display who owns most privileged accounts in bar chart"
**Important**: The AI assistant is in early alpha. Always verify the dimensions, metrics, and filters it selects. Use it as a starting point, then refine manually as needed.
 ## Key Things to Know
### Data Refresh Schedule
* **Dashboard data updates daily at 3:00 AM PT**
* Check the "Data freshness" label on each dashboard to see the last update time
* Dashboards have a 24-hour delay compared to real-time data in the main Lumos app
### Access and permissions
* Dashboards are private by default - only you can see dashboards you create
* Share dashboards with specific users and choose "Can view" or "Can edit" permissions
* Non-admin users can access dashboards that are shared with them
* Organization admins and readonly organization admins can access the Analytics section by default
### Data Accuracy Tips
If dashboard numbers don't match what you expect:
1. **Check filters** - Make sure you're filtering out ignored apps and accounts, terminated users, and non-human accounts
2. **Account for data delay** - Recent changes take 24 hours to appear in dashboards
3. **Verify in source** - Use "Admin URL" links to see the underlying data and confirm accuracy
## Troubleshooting
### "I don't see the Analytics tab"
**Solution**: Verify you have org admin or readonly org admin permissions, or ask your administrator if they've shared any dashboards with you. If dashboards have been shared with you, you'll see them in the Analytics section even without admin permissions.
### "AI assistant created a wrong or broken chart"
**Solution**: This is expected during the alpha phase. Manually verify and adjust the:
* Dimensions (what you're grouping by)
* Metrics (what you're measuring)
* Filters (what data to include/exclude)
* Chart type (bar, pie, table, etc.)
### "My custom dashboard data looks outdated"
**Solution**: Check the data freshness timestamp. If it's older than 24 hours past 3:00 AM PT, contact support as this indicates a refresh issue.
## Monthly Review Workflow
**Recommended practice**: Set up monthly meetings to review key security and access metrics:
### Security-Focused Review
* **Orphaned accounts**: Identify accounts for users no longer in the HRIS
* **Partially offboarded users:** Find terminated employees who still have access to sensitive systems.
* **New risky applications**: Review recently discovered apps in high-risk categories
* **Dormant privileged accounts**: Find privileged access that hasn't been used recently
* **New blocklisted accounts:** Review recent sign-ups in blocklisted applications.
### Optimization-Focused Review
* **License utilization**: Identify unused seats and duplicate accounts
* **Department-specific insights**: Share relevant dashboards with department heads
* **Trend analysis**: Track improvements in security posture over time
Use your dashboards as the foundation for these discussions, and track your progress month-over-month using the historical data.
## Setup complete
You can now replace manual reporting with automated dashboards. Start with templates, then build custom dashboards as your needs evolve.
**Next Steps:**
* Explore all four template dashboards to understand the full scope of available insights
* Schedule your first monthly review meeting with relevant stakeholders
* Share your most useful dashboards with team members who need visibility
* Bookmark your most useful dashboards for quick daily access
* Consider which department heads would benefit from specific dashboard views
**Need Help?** Contact your Lumos account team with any questions about dashboard setup, data accuracy, or advanced customization needs.
## Key Things to Know
### Data Refresh Schedule
* **Dashboard data updates daily at 3:00 AM PT**
* Check the "Data freshness" label on each dashboard to see the last update time
* Dashboards have a 24-hour delay compared to real-time data in the main Lumos app
### Access and permissions
* Dashboards are private by default - only you can see dashboards you create
* Share dashboards with specific users and choose "Can view" or "Can edit" permissions
* Non-admin users can access dashboards that are shared with them
* Organization admins and readonly organization admins can access the Analytics section by default
### Data Accuracy Tips
If dashboard numbers don't match what you expect:
1. **Check filters** - Make sure you're filtering out ignored apps and accounts, terminated users, and non-human accounts
2. **Account for data delay** - Recent changes take 24 hours to appear in dashboards
3. **Verify in source** - Use "Admin URL" links to see the underlying data and confirm accuracy
## Troubleshooting
### "I don't see the Analytics tab"
**Solution**: Verify you have org admin or readonly org admin permissions, or ask your administrator if they've shared any dashboards with you. If dashboards have been shared with you, you'll see them in the Analytics section even without admin permissions.
### "AI assistant created a wrong or broken chart"
**Solution**: This is expected during the alpha phase. Manually verify and adjust the:
* Dimensions (what you're grouping by)
* Metrics (what you're measuring)
* Filters (what data to include/exclude)
* Chart type (bar, pie, table, etc.)
### "My custom dashboard data looks outdated"
**Solution**: Check the data freshness timestamp. If it's older than 24 hours past 3:00 AM PT, contact support as this indicates a refresh issue.
## Monthly Review Workflow
**Recommended practice**: Set up monthly meetings to review key security and access metrics:
### Security-Focused Review
* **Orphaned accounts**: Identify accounts for users no longer in the HRIS
* **Partially offboarded users:** Find terminated employees who still have access to sensitive systems.
* **New risky applications**: Review recently discovered apps in high-risk categories
* **Dormant privileged accounts**: Find privileged access that hasn't been used recently
* **New blocklisted accounts:** Review recent sign-ups in blocklisted applications.
### Optimization-Focused Review
* **License utilization**: Identify unused seats and duplicate accounts
* **Department-specific insights**: Share relevant dashboards with department heads
* **Trend analysis**: Track improvements in security posture over time
Use your dashboards as the foundation for these discussions, and track your progress month-over-month using the historical data.
## Setup complete
You can now replace manual reporting with automated dashboards. Start with templates, then build custom dashboards as your needs evolve.
**Next Steps:**
* Explore all four template dashboards to understand the full scope of available insights
* Schedule your first monthly review meeting with relevant stakeholders
* Share your most useful dashboards with team members who need visibility
* Bookmark your most useful dashboards for quick daily access
* Consider which department heads would benefit from specific dashboard views
**Need Help?** Contact your Lumos account team with any questions about dashboard setup, data accuracy, or advanced customization needs.